Chart 1.
 Although the age of whakapapa researchers differs significantly from those investigated in earlier research, in terms of gender, results were quite similar to other studies. In this study there was a slightly lower percentage of female researchers (59%) than Kuglin (2004) and Drake (2001) but this was similar to Lambert’s (1998) results (Chart 2)(Appendix 2, Question 21). In all of the research undertaken female researchers have significantly outnumbered males and this tendency is confirmed by the data in this study also.
Chart 2.
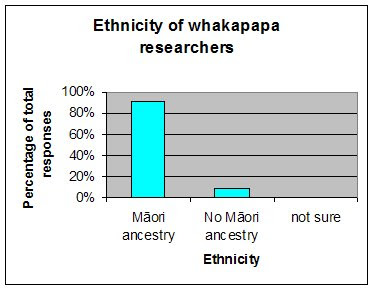
 As expected the vast majority of respondents had Māori ancestry (Chart 3). It was the researcher’s experience however, that whakapapa researchers were not exclusively those with Māori ancestry and this was confirmed by the 3 respondents who identified themselves as non-Māori. This question (Appendix 2,Question 23) was included to get some idea of how many whakapapa researchers fit into this category as no previous research has looked at this and it was hoped that data from other questions could be analysed with reference to the ethnicity of the respondent. Due to the small number of non-Māori respondents it was decided that this would not provide meaningful results.
Chart 3.


No comments:
Post a Comment